100% visibility,
all the time.
Cover your entire Kubernetes stack instantly with no code changes using the superpowers of eBPF instrumentation.
Solve unknowns, unimaginably fast.
Deploy anywhere, within minutes. Troubleshoot & improve your application and infrastructure performance with K8s context and mind-blowing data granularity.
Take control of your data, all in-cloud.
groundcover’s unique inCloud architecture keeps your data private, secured and under your control without ever leaving your cloud premises.
Reduce costs,
scale to new heights.
Control your budget and avoid unexpected
spikes in cost with a flat, predictable price.
Cut up to 90% of your costs with no trade-offs about what to observe. Any volume of logs, metrics, or traces - the price stays the same.


Legacy vendor, out. A truly cloud-native APM, in.
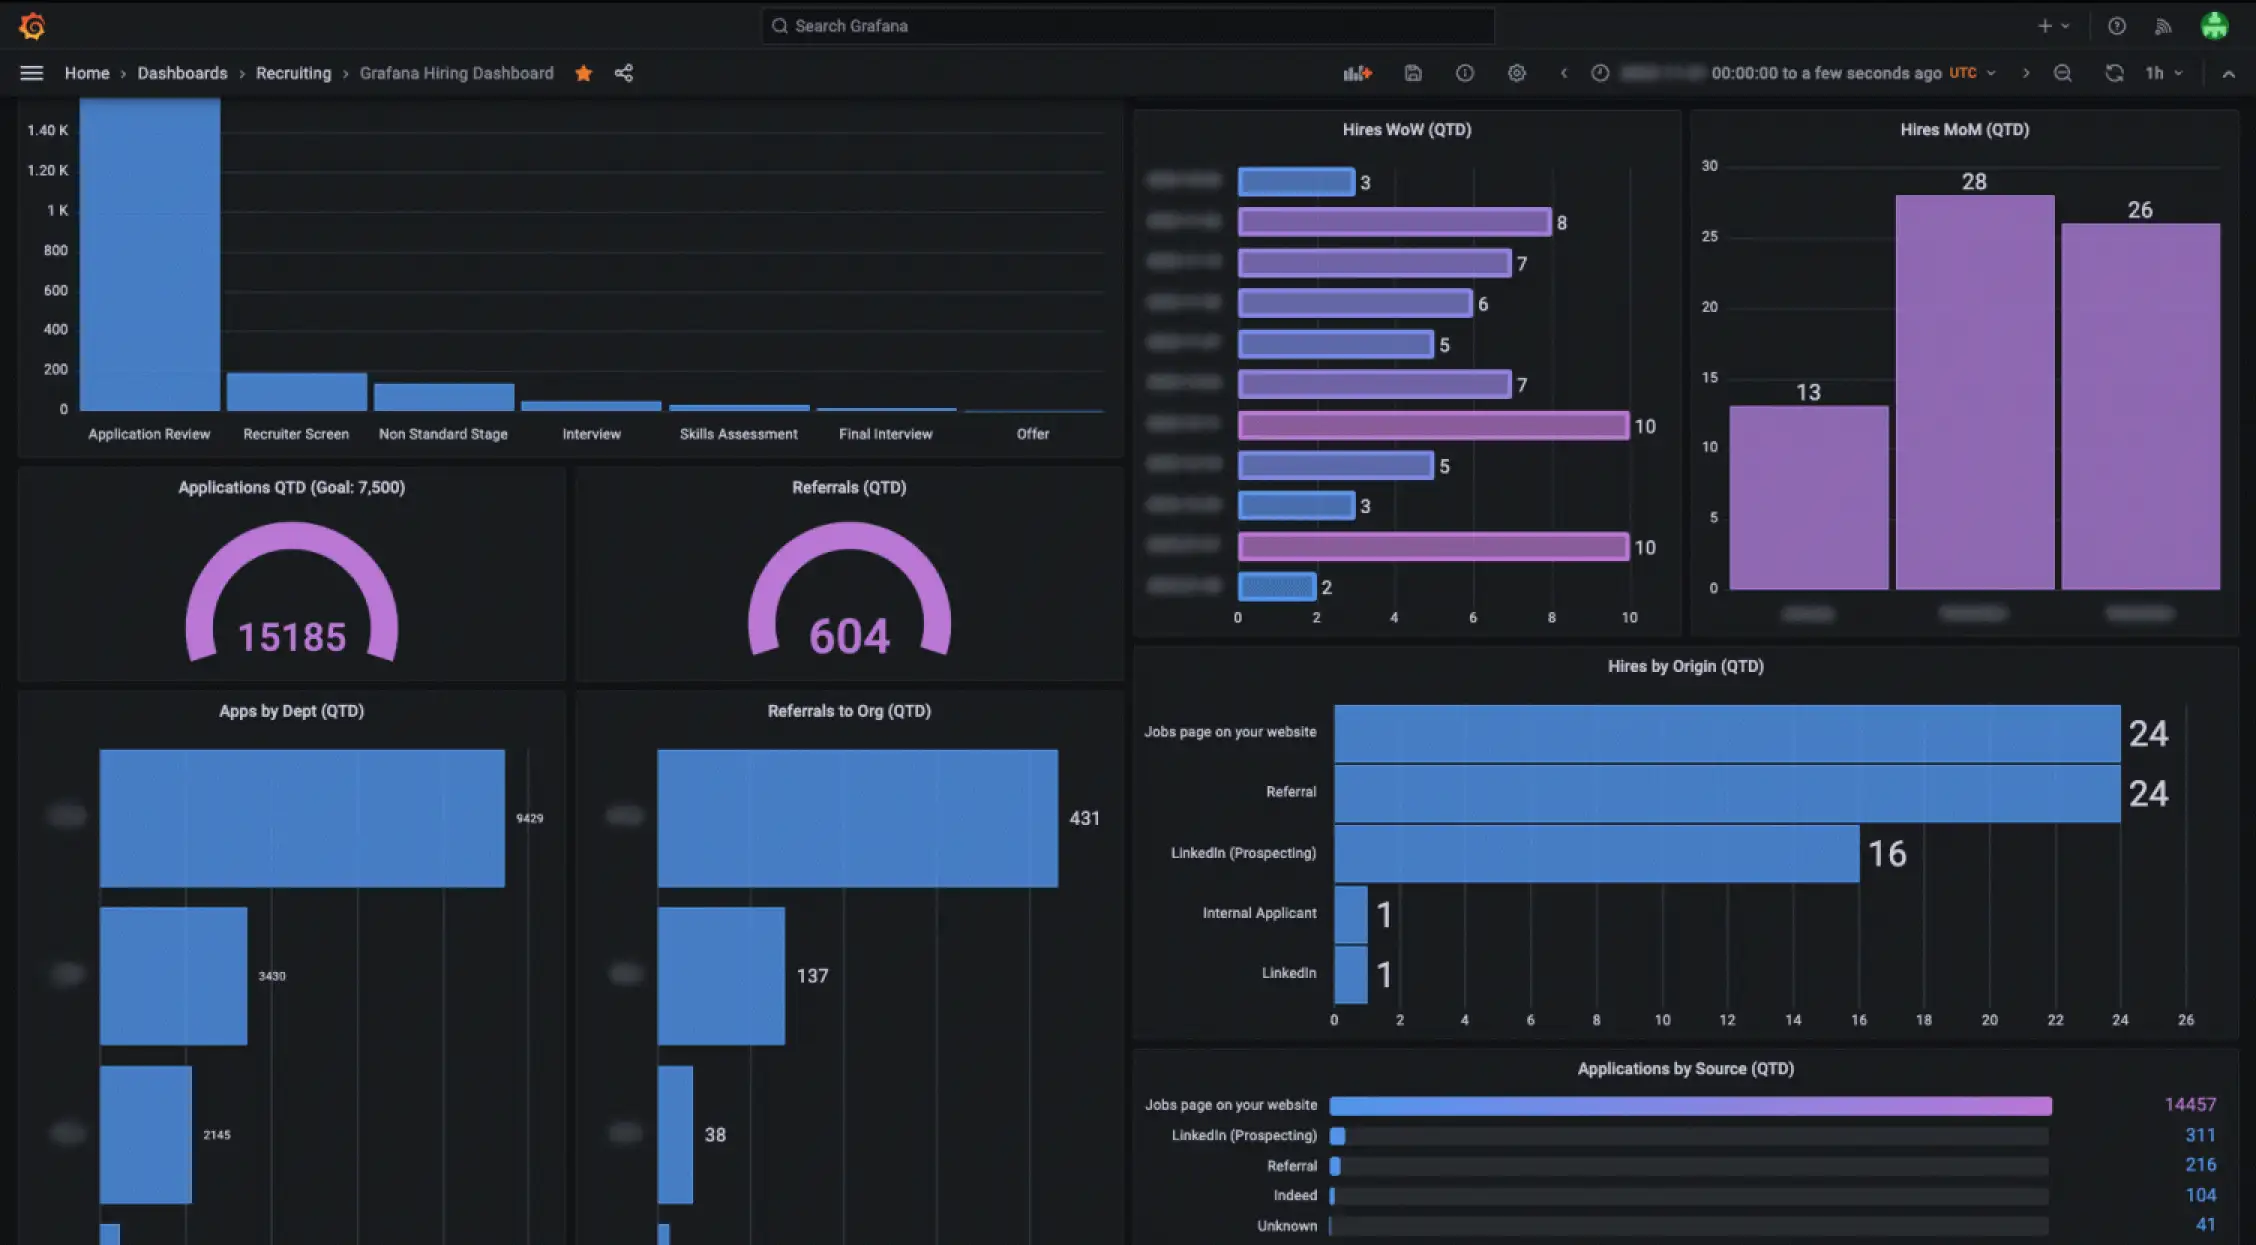
Executive Dashboards
- Purpose: Provide a high-level overview of the organization’s performance.
- Users: Executives, C-suite leaders, senior management.
- Features: Key performance indicators (KPIs), financial summaries, strategic goal tracking, market analysis, and trend projections.
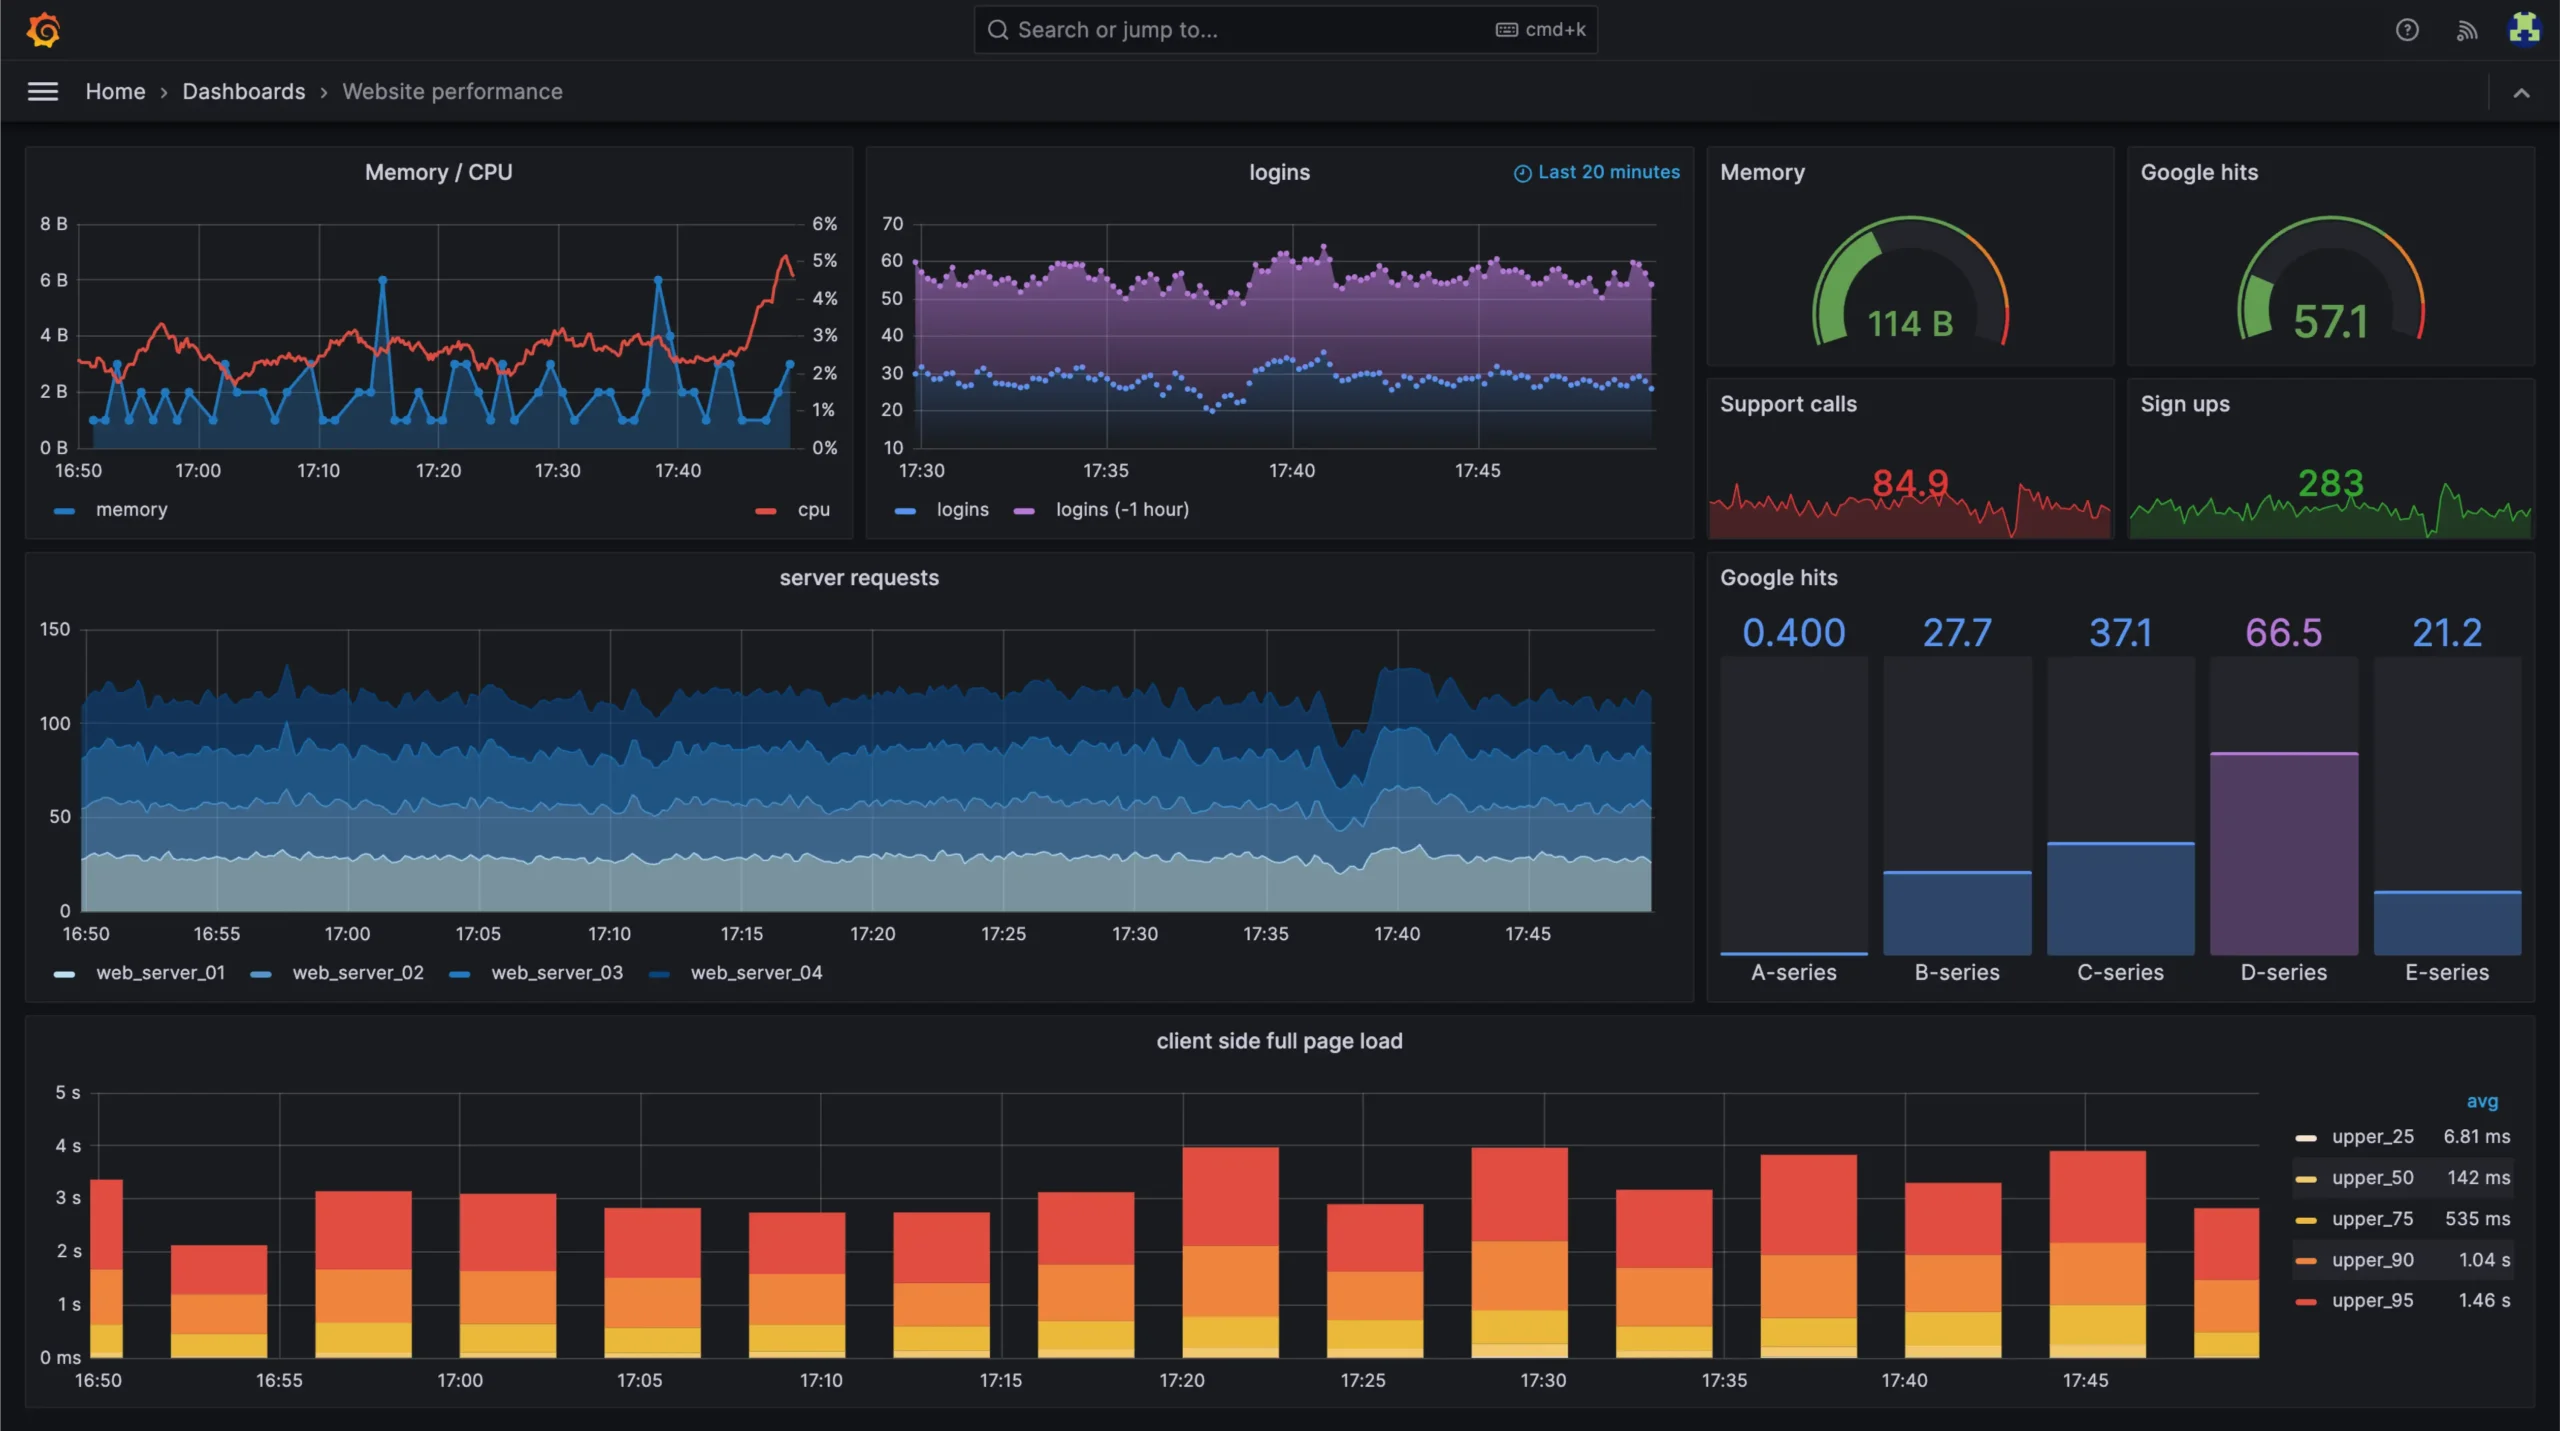
Analytical Dashboards
- Purpose: Analyze complex datasets to uncover trends, insights, and patterns.
- Users: Data analysts, business analysts, data scientists.
- Features: Detailed data visualizations, historical data analysis, predictive analytics, data correlations, and drill-down capabilities.
Strategic Dashboards
- Purpose: Track the progress towards long-term strategic goals.
- Users: Strategic planners, senior executives, project managers.
- Features: Goal tracking, initiative performance, milestone progress, and strategic KPIs.
Financial Dashboards
- Purpose: Manage and monitor financial performance and health.
- Users: CFOs, financial analysts, accountants.
- Features: Revenue metrics, expense tracking, profit and loss statements, budget vs. actuals, cash flow analysis.