SAP Analytics Cloud Dashboards
Turning SAP Data into Enterprise Intelligence
Most enterprises generate massive amounts of SAP data across operations, finance, sales, and HR. Yet this data often sits in silos — scattered across SAP Cloud ALM, S/4HANA, or other systems — making it hard to visualize, analyze, and act upon.
SAP Analytics Cloud dashboards bring all your SAP insights together in a single, interactive view, eliminating blind spots and enabling real-time, data-driven decisions across the enterprise.
Why Use SAC Dashboards?
SAP systems power critical business processes, but many organizations:
- Analyze SAP data manually or in disconnected reports
- Struggle with cross-module visibility
- Miss early warning patterns in operations
- Lack proactive business insights
With SAC dashboards, you can transform raw SAP and Cloud ALM data into executive-ready visuals, operational KPIs, and predictive insights — all in one place.
What’s Required for Professional Dashboard Deployment?
1. Data Extraction & Connectivity
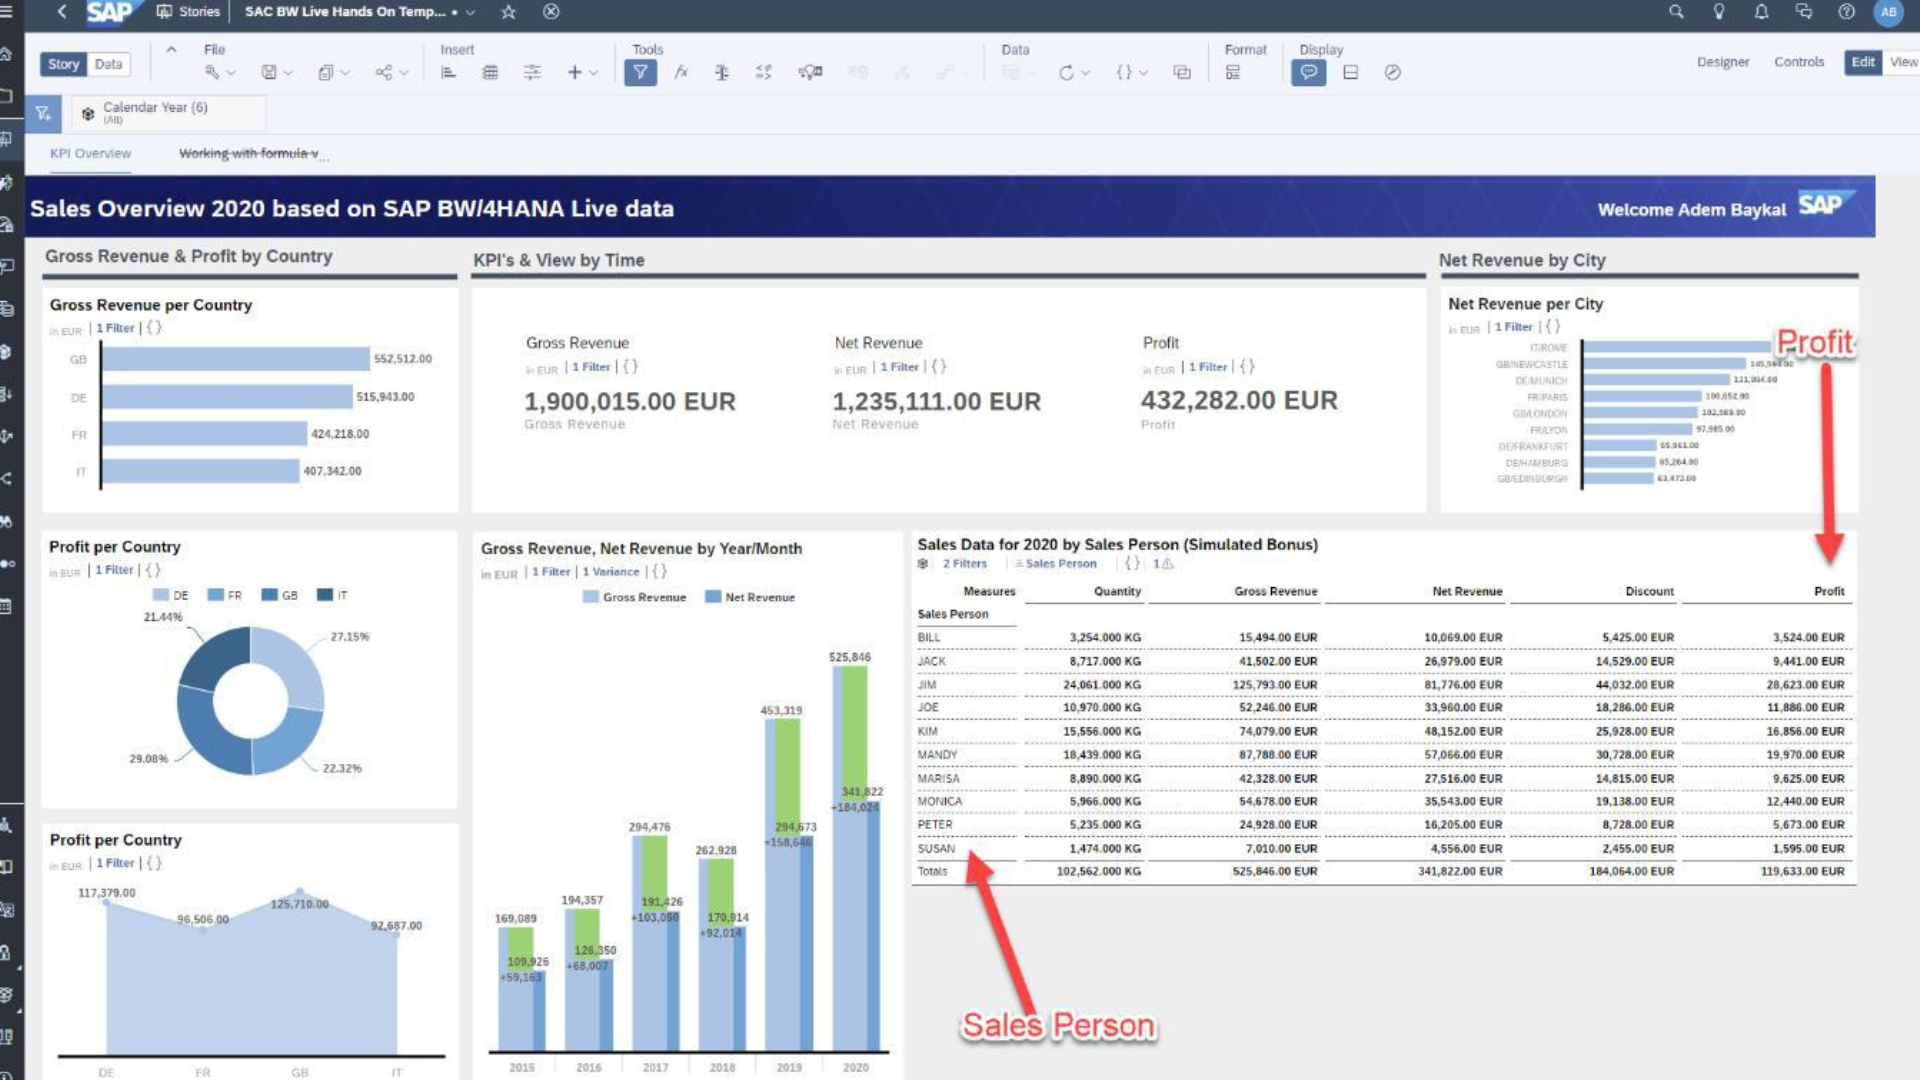
- Connect to SAP Cloud ALM, S/4HANA, BW, and other SAP or non-SAP sources
- Extract real-time operational, financial, and user activity data
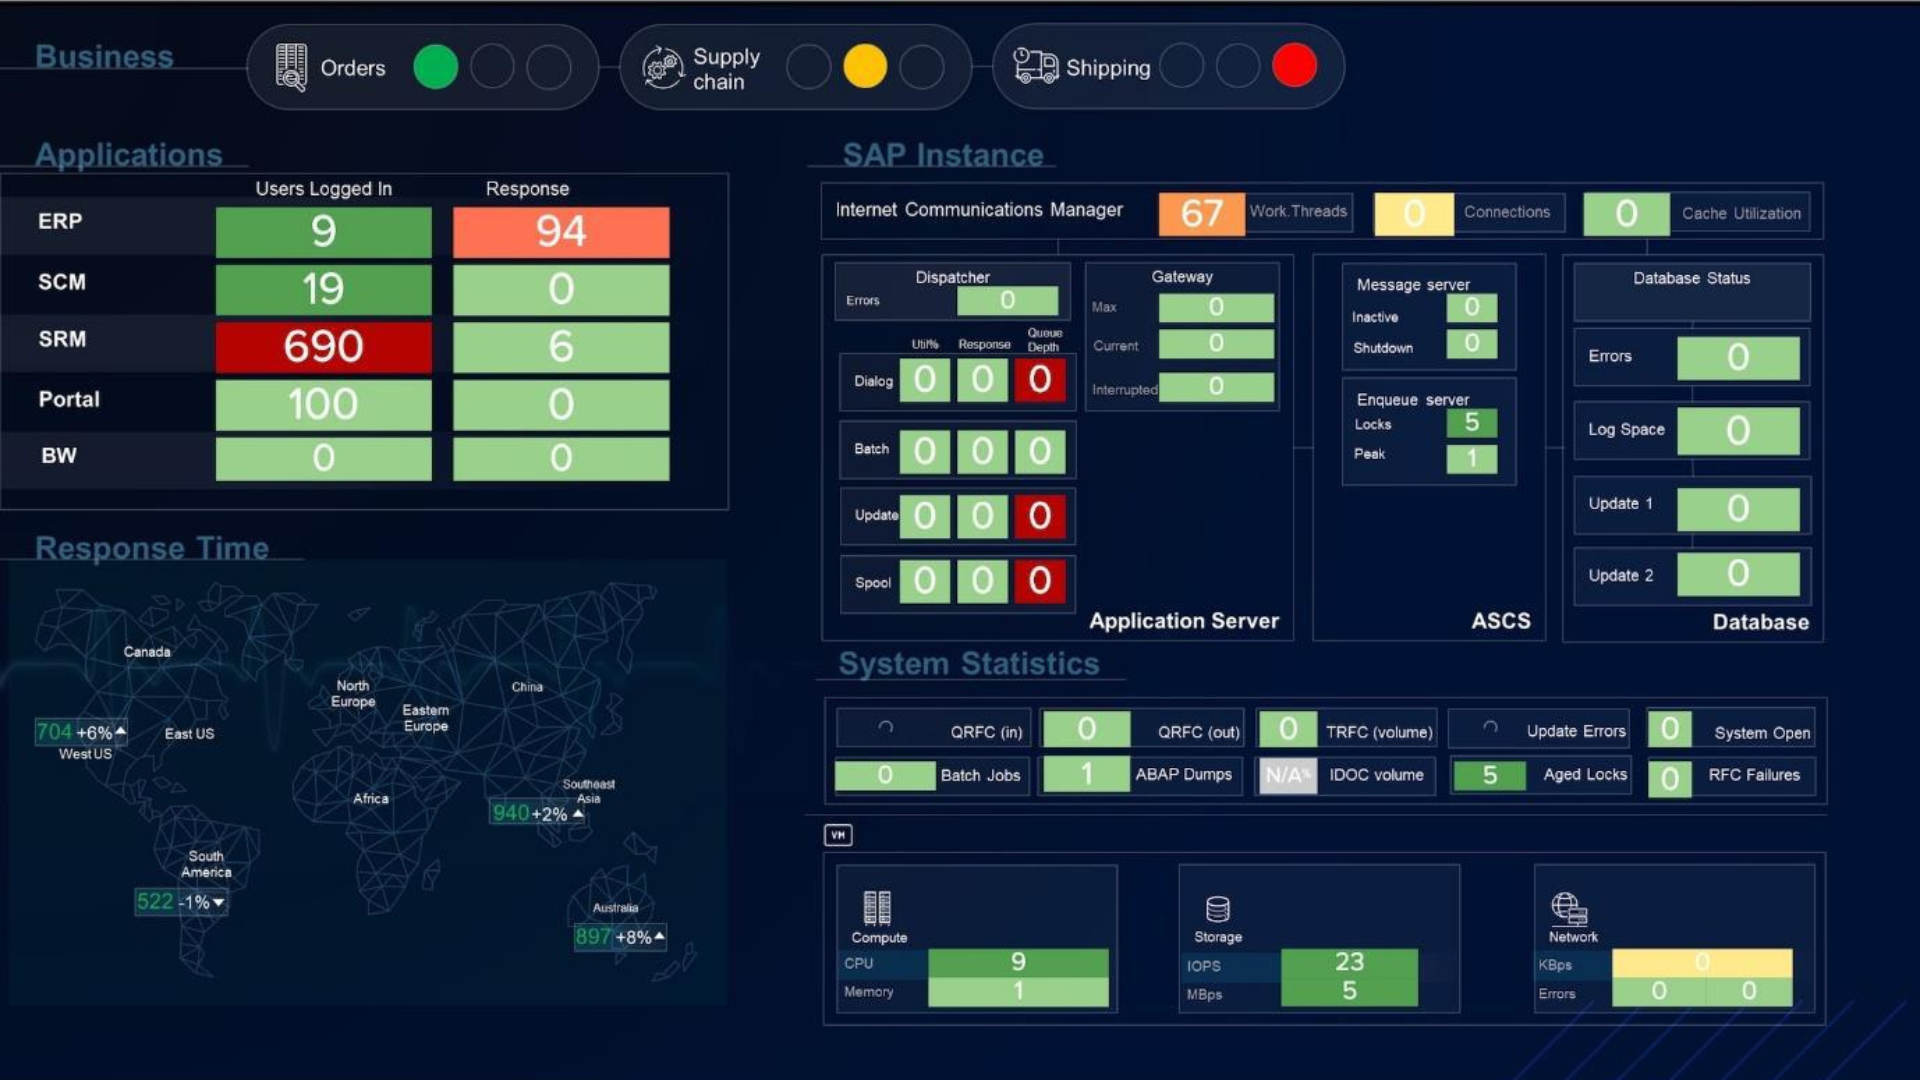
- Include integration, job, and system health metrics
- Filter and categorize data for meaningful analytics
2. Data Modeling & Transformation
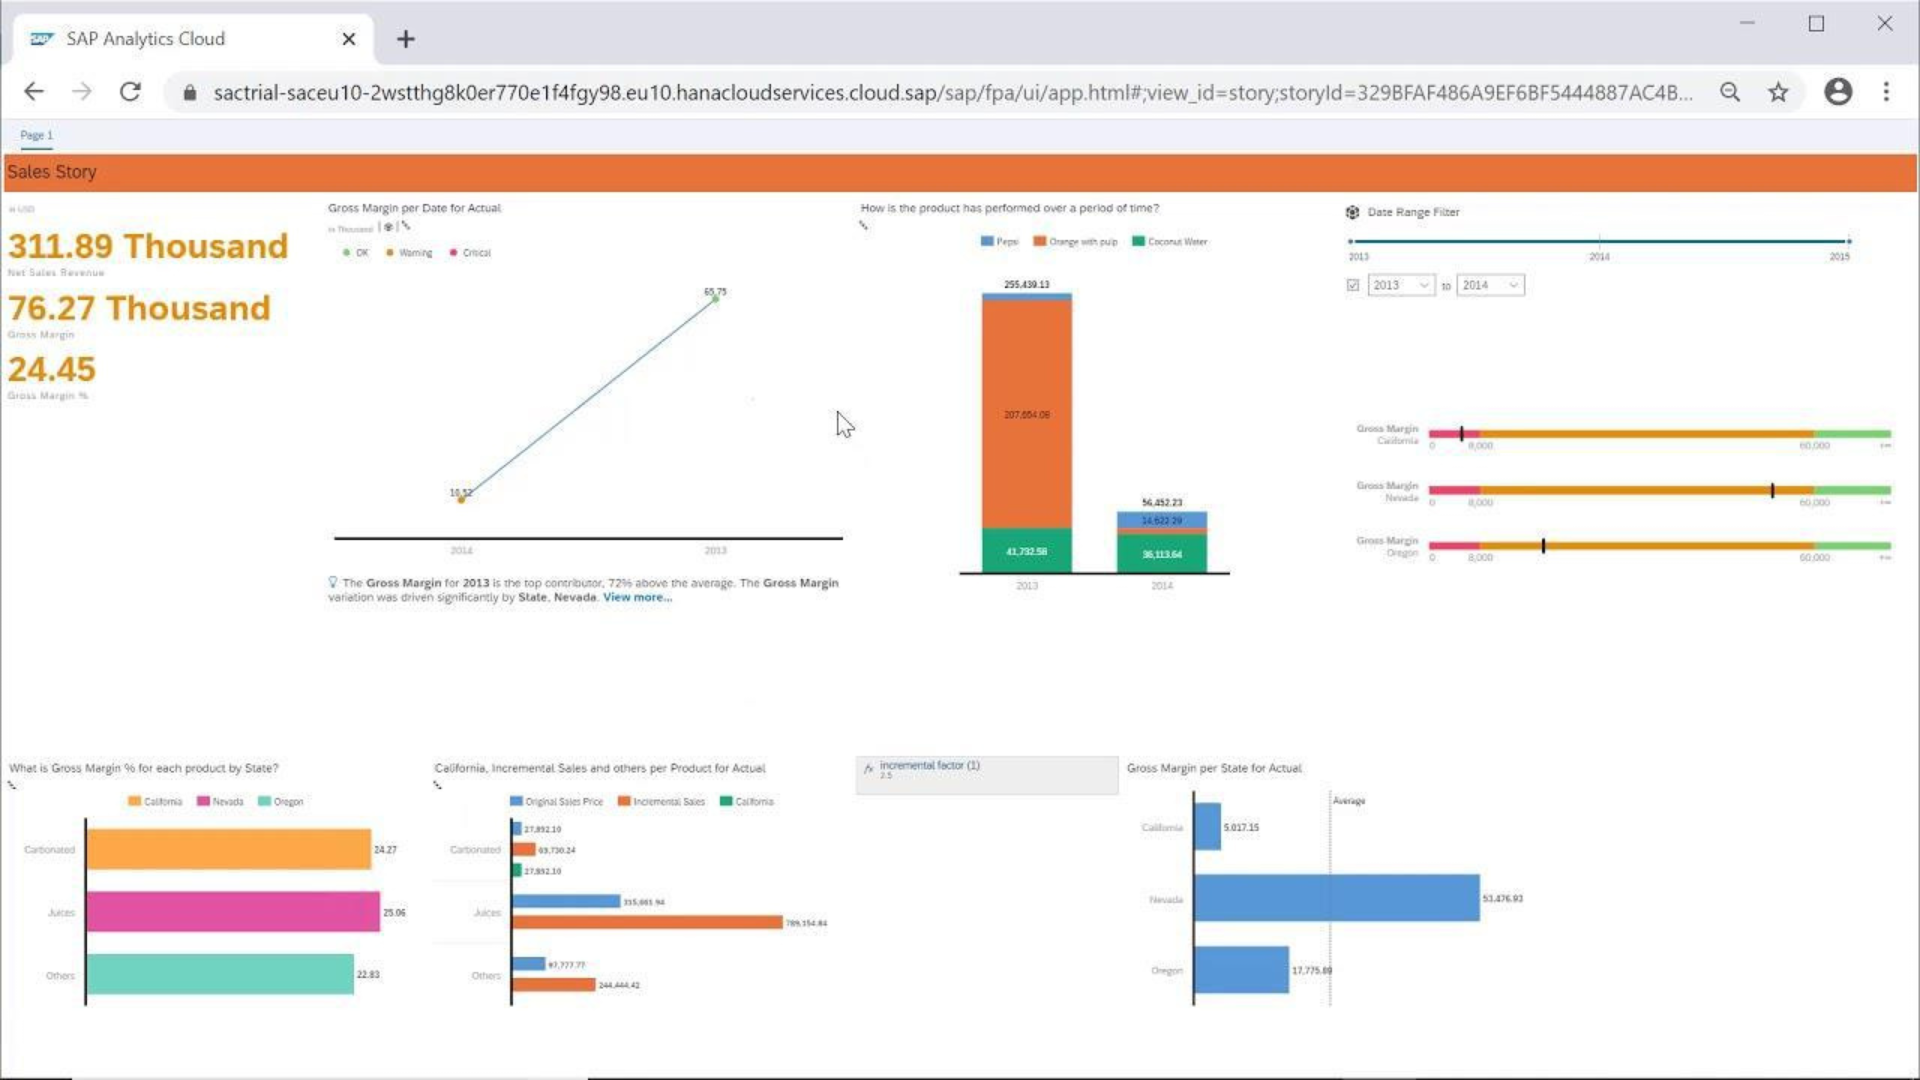
- Build reusable SAC models and stories
- Normalize KPIs across systems
- Define metrics, hierarchies, and calculated fields
- Ensure real-time refresh or scheduled data updates
3. Security & Access Management
- Role-based access to dashboards and data
- Compliance-aligned sharing and governance
- Secure authentication and single sign-on support
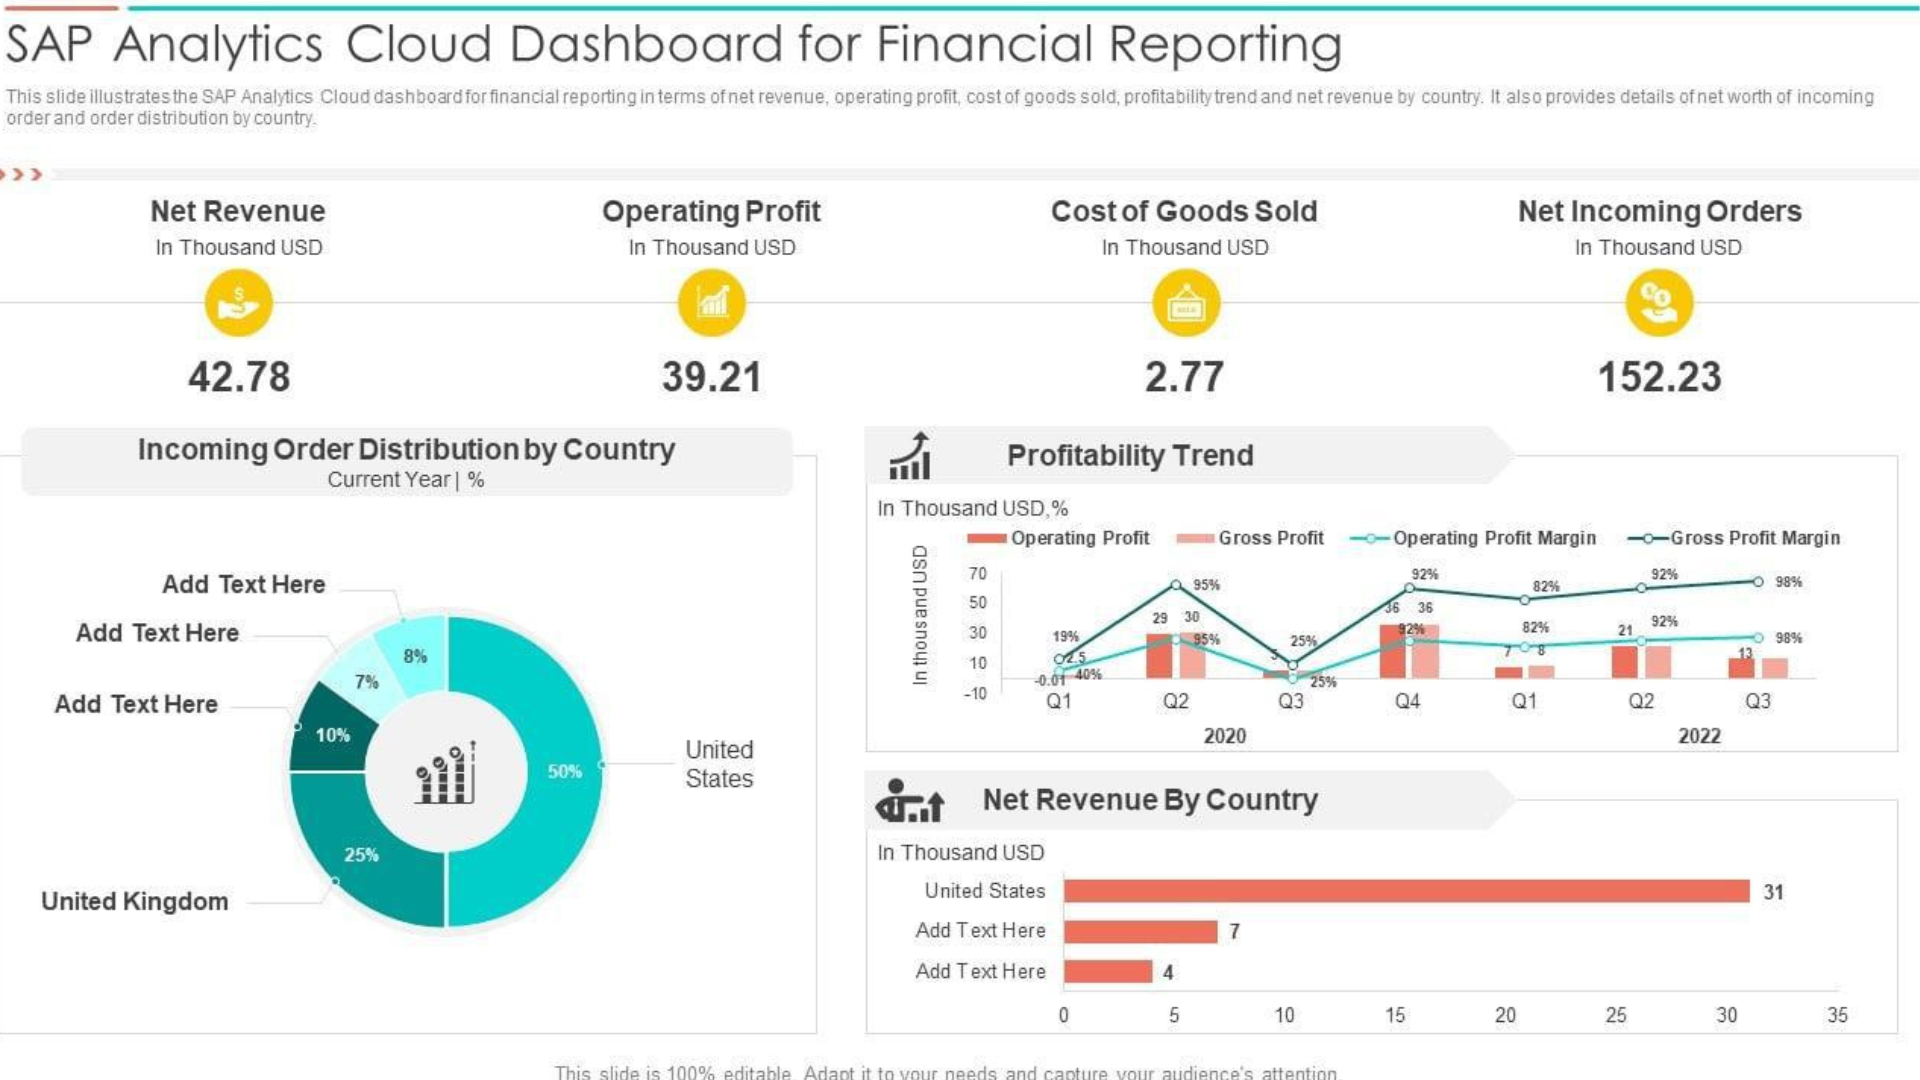
4. Dashboard Design & Visualization
- Executive KPIs and system health overviews
- Operational drill-downs for IT, finance, and sales
- Predictive analytics and trend insights
- Interactive charts, maps, and tables — not just raw numbers
5. Alerts & Monitoring Integration (Optional)
- Event-driven alerts for SLA breaches or system anomalies
- Integration with Cloud ALM or other monitoring tools for operational insights
- Automated notifications for stakeholders
What You Gain
Centralized Enterprise Visibility
All SAP data in one unified, visual layer.
Real-Time, Actionable Insights
Identify trends, anomalies, or bottlenecks across operations, finance, or integration points.
Predictive Analytics & Early Warnings
Forecast potential issues before they impact the business.
Enhanced Governance & Compliance
Track SLA adherence, recurring incidents, and system performance trends.
Executive & Operational Dashboards
Provide tailored dashboards for executives, line-of-business users, and IT operations without technical clutter.
Typical Enterprise Use Cases
- SAP operational monitoring in real-time
- Finance & sales KPIs on one platform
- Centralized dashboards post-Solution Manager retirement
- Hybrid monitoring combining Cloud ALM and SAC analytics
- Predictive insights for proactive decision-making
Common Pitfalls (Why Expertise Matters)
- Building dashboards without structured data models
- Overloading dashboards with raw, unfiltered data
- No governance or access control
- Poor visualization design leading to low adoption
- Ignoring refresh strategy for real-time insights
Result? Confusing dashboards, low adoption, and missed business opportunities.
Our Approach
At CloudALMexperts, we focus on:
- Architecture-first SAC dashboard design
- Governance-aligned KPIs and metrics
- Scalable models with real-time refresh
- Clean, executive-ready dashboards
- Integration with Cloud ALM, S/4HANA, and other SAP sources